
How to Calculate SIP Returns Online in 3 Simple Steps
A Systematic Investment Plan (SIP) is a disciplined investment methodology that allows retail investors to contribute a fixed monetary sum into mutual funds, index funds, or exchange-traded funds (ETFs) at regular intervals (typically monthly). Rather than attempting to time volatile market peaks and troughs, SIP investors harness dollar-cost averaging and multi-decade compound interest to build substantial long-term wealth.
- Enter Monthly SIP Contribution: Type the recurring amount you plan to invest each month (e.g. $100, $500, or $1,000) into the monthly budget field.
- Set Expected Annual Return Rate: Enter your anticipated Compound Annual Growth Rate (CAGR). Historically, broad equity market indices (like the S&P 500 or Nifty 50) have delivered 10% to 14% annualized returns over 10- to 20-year horizons.
- Select Investment Horizon: Choose your target holding duration between 1 year and 35 years. The calculator instantly generates your total invested capital, estimated capital gains, and total projected corpus.
All financial projections are calculated locally in your browser memory. Your financial plans, salary numbers, and investment targets remain 100% confidential.
The Mathematical SIP Compounding Formula
Because SIP investments involve recurring periodic deposits made at the beginning of each monthly cycle, the calculation uses the future value of an annuity due formula:
$$M = P \cdot \frac{(1 + i)^n - 1}{i} \cdot (1 + i)$$
Where:
- $M$ (Maturity Corpus): The total accumulated portfolio value at the end of the investment tenure.
- $P$ (Periodic Monthly Installment): The fixed amount invested on each monthly billing date.
- $i$ (Periodic Monthly Interest Rate): The annual nominal expected return rate divided by 12 months, expressed in decimal form: $i = \frac{R}{12 \times 100}$. For an annual rate of 12%, $i = \frac{12}{1200} = 0.01$.
- $n$ (Total Number of Monthly Installments): The total number of contributions across the tenure ($n = \text{Years} \times 12$). A 15-year SIP represents $n = 180$ monthly installments.
Step-by-Step Mathematical Walkthrough
Suppose you invest $500 per month into an equity index mutual fund delivering an expected 12.0% annual CAGR over 15 years (180 months):
- Calculate monthly rate: $i = \frac{12}{1200} = 0.01$
- Compute compounded growth factor: $(1 + 0.01)^{180} \approx 5.9958$
- Evaluate numerator: $5.9958 - 1 = 4.9958$
- Divide by monthly rate: $\frac{4.9958}{0.01} = 499.58$
- Multiply by monthly contribution: $500 \times 499.58 = 249,790$
- Multiply by annuity-due factor: $249,790 \times 1.01 \approx \$252,288$
Over 15 years, your out-of-pocket investment is $\$500 \times 180 = \mathbf{\$90,000}$. Meanwhile, your estimated investment returns equal $\mathbf{\$162,288}$, delivering an overall wealth multiplier of 2.8× your invested capital!
The Compounding Explosion: $500/Month at 12% CAGR Across 30 Years
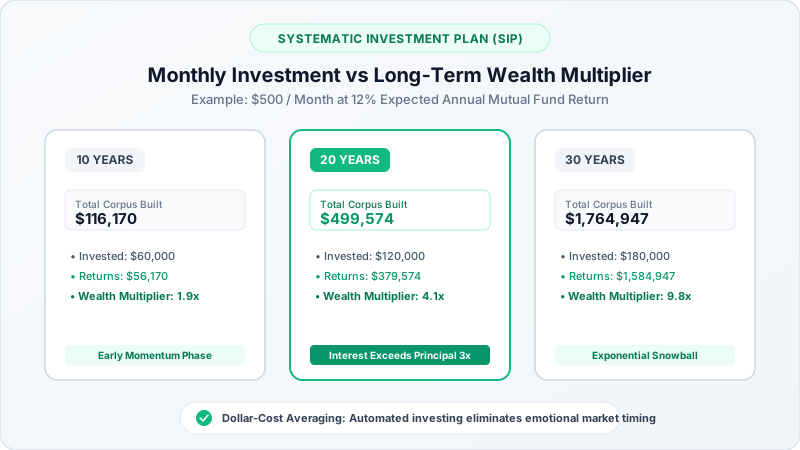
The true magic of systematic investing reveals itself after Year 10, when compound interest begins to outpace your out-of-pocket capital contributions:
| Investment Horizon | Total Amount Invested | Estimated Wealth Gain | Total Portfolio Corpus | Wealth Multiplier |
|---|---|---|---|---|
| 5 Years (60 Months) | $30,000 | $11,249 | $41,249 | 1.37× |
| 10 Years (120 Months) | $60,000 | $56,017 | $116,017 | 1.93× |
| 15 Years (180 Months) | $90,000 | $159,796 | $249,796 | 2.78× |
| 20 Years (240 Months) | $120,000 | $379,574 | $499,574 | 4.16× |
| 25 Years (300 Months) | $150,000 | $800,000+ | $950,000+ | 6.33× |
| 30 Years (360 Months) | $180,000 | $1,584,974 | $1,764,974 | 9.80× |
[!IMPORTANT]
Observe the exponential transition between Year 20 and Year 30:
- Between Years 1 and 20 ($120,000 invested), your portfolio reached $499,574.
- In the next 10 years (investing only $60,000 more), your portfolio grew by an astounding $1,265,400, surging to $1,764,974!
This phenomenon occurs because the accumulated interest itself earns substantial annual returns.
Dollar-Cost Averaging: Why Market Corrections Benefit SIP Investors
The primary psychological obstacle for individual retail investors is market volatility. When stock prices drop 20%, emotional investors panic and sell at the bottom. SIP eliminates this emotional vulnerability through dollar-cost averaging (DCA):
How Dollar-Cost Averaging Works
Because you invest an identical dollar amount each month, you automatically:
- Purchase fewer mutual fund units when stock prices and NAVs are expensive.
- Purchase significantly more mutual fund units when stock prices and NAVs crash.
Real-World Example: Market Crash Scenario ($500 Monthly SIP)
| Month | Fund NAV Price | Units Purchased with $500 | Market Sentiment |
|---|---|---|---|
| January | $50.00 | 10.00 Units | Market High |
| February | $40.00 | 12.50 Units | Correction |
| March | $25.00 | 20.00 Units | Market Crash (-50%) |
| April | $35.00 | 14.28 Units | Rebound |
| May | $50.00 | 10.00 Units | Market Fully Recovered |
| Summary | $40.00 Avg NAV | 66.78 Total Units | Portfolio Value: $3,339.00 |
Even though the market merely broke even by May ($50 to $50), the SIP investor turned $2,500 in contributions into $3,339, generating a +33.5% return purely by accumulating discounted units during the crash!
SIP vs. Lump-Sum Investing: Which Strategy Wins?
| Feature | Systematic Investment Plan (SIP) | Lump-Sum Investment |
|---|---|---|
| Entry Timing Risk | Zero timing risk (spread across cycles) | High (investing at market peaks hurts returns) |
| Capital Requirement | Low (start with as little as $10 to $50/mo) | High (requires significant upfront capital) |
| Psychological Stress | Low (automated, stress-free routine) | High (fear of immediate post-purchase crash) |
| Ideal Market Environment | Volatile, sideways, or bear markets | Strongly rising secular bull markets |
| Cash Flow Matching | Perfectly matches monthly salary income | Suited for bonuses, inheritances, property sales |
If you have a lump-sum windfall today, financial advisors frequently recommend a Systematic Transfer Plan (STP): park the money in a safe, liquid cash fund and transfer a fixed monthly tranche into an equity fund over 12 to 24 months to minimize timing risk.
The Superpower of Step-Up SIP: Beating Flat Contributions
As your salary and earning potential expand over your working career, maintaining a static monthly contribution leaves potential wealth on the table. A Step-Up SIP (or Top-Up SIP) increases your monthly installment by a fixed percentage (typically 10%) each year.
Flat $500/Month vs. 10% Step-Up SIP Over 20 Years at 12% CAGR
| Strategy | Total Capital Invested | Final Portfolio Corpus | Wealth Advantage |
|---|---|---|---|
| Flat SIP ($500/month) | $120,000 | $499,574 | Baseline |
| 10% Step-Up SIP | $343,650 | $1,173,854 | +$674,280 (+135%) |
By stepping up your investment alongside annual career salary increments, you accumulate over $1.17 million—more than double the flat SIP outcome!
Mutual Fund Categories & Expected Historical Returns
When entering expected return rates into the SIP calculator, use realistic historical assumptions based on asset category:
| Asset Category | Benchmark Index | Risk Profile | Realistic 10-Yr CAGR | Suggested Investment Horizon |
|---|---|---|---|---|
| Large-Cap / Index Funds | S&P 500 / Nifty 50 | Moderate | 10% – 12% | 5+ Years |
| Flexi-Cap / Multi-Cap | Total Stock Market | Moderate-High | 11% – 13% | 7+ Years |
| Mid-Cap Funds | S&P MidCap 400 | High | 13% – 15% | 7+ Years |
| Small-Cap Funds | Russell 2000 | Very High | 14% – 17% | 10+ Years |
| Balanced / Hybrid Funds | 60/40 Equity/Bond | Low-Moderate | 8% – 10% | 3 to 5 Years |
Spreadsheet Formulas: Calculating SIP in Excel & Google Sheets
You can project SIP wealth growth directly in spreadsheet software using the =FV() function:
```excel
=FV(rate, nper, pmt, [pv], [type])
```
- rate: Monthly interest rate (
Annual_Rate / 12). For 12% in cell B2, enter=B2/12. - nper: Total monthly periods (
Years 12). For 15 years in cell B3, enter=B312. - pmt: Monthly installment. Enter as a negative number (
-500) to reflect monthly cash investment. - pv: Initial lump-sum already in the fund (or
0). - type: Set to
1because SIP installments occur at the beginning of each month (annuity due). - Example Formula:
=FV(12%/12, 15*12, -500, 0, 1)accurately returns $252,288.03.